Fish need oxygen dissolved in the water to breathe. Hypoxia means there isn't much of that oxygen available. You may have heard the Gulf's low-oxygen bottom area called the dead zone. That name doesn't mean every layer of water is empty of fish.
Low oxygen can reduce the space fish can use and change where they find food. Catching fish nearby doesn't show that the bottom water is healthy. This page puts three different kinds of evidence together: annual forecasts and surveys, historical oxygen measurements, and a published fish study. Keep each one's place, period, unit and outcome attached; they are not a single dataset measuring fish responses to today's oxygen.
How bottom water loses oxygen
Nutrients are substances that help plants and algae grow. River water brings nutrients into the Gulf. When that plant and algal material breaks down, the process uses oxygen.
Fresh river water can form a lighter layer above saltier water. This layering, also called stratification, slows the replacement of oxygen in deeper water. Wind and waves can mix the layers, but the effect depends on the actual water and weather.
The conventional mapping threshold here is 2 milligrams of oxygen per litre of water, written 2 mg/L, or less. That classification isn't a universal survival limit for every animal.
A forecast and a survey answer different questions
A forecast estimates what may happen using a calculation and its assumptions. A survey records what a research team finds during its visit. Neither describes every day of summer.
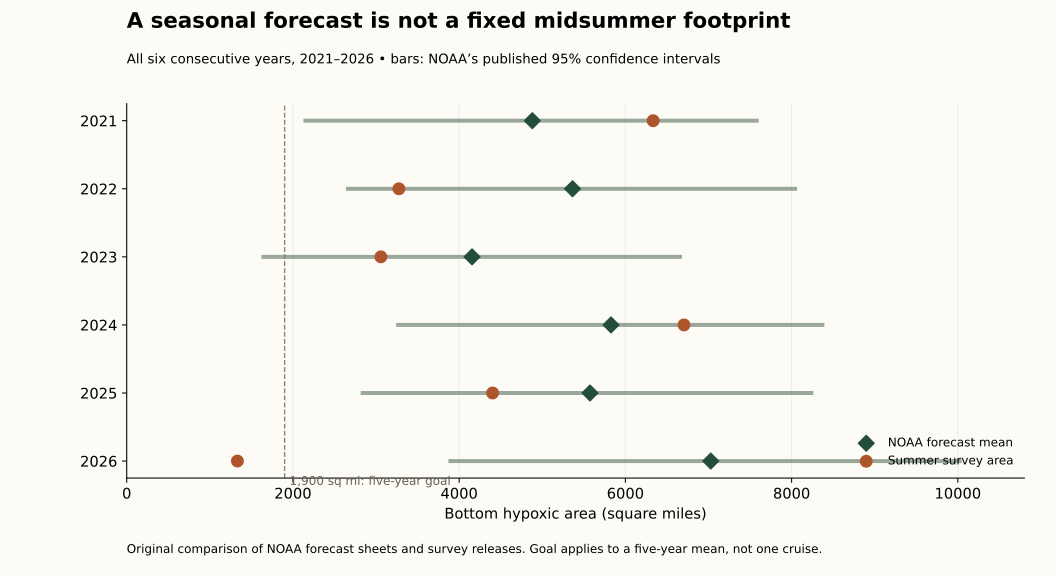
In the 2026 agency accounts, the National Oceanic and Atmospheric Administration (NOAA) forecast 7,027 square miles of low-oxygen bottom area. The later survey reported 1,332 square miles. The published forecast range was 3,895–10,021, so the survey result fell below it.
NOAA's account attributed the smaller measured footprint to storm mixing before the cruise. It also said the survey did not capture the full extent. These are the agency's reported result and interpretation, not a storm effect independently measured by this site.
Across all six saved forecast/survey pairs from 2021–2026, five survey values fell inside their forecast ranges. The average size of the forecast miss was about 2,064 square miles. Six changing annual cases don't establish next year's error.
The retained annual comparison keeps forecast, source range, survey result and signed difference together. The average absolute miss describes those saved pairs, not a typical maximum error or a new confidence range for the next forecast.
The management goal concerns a five-year average around 1,900 square miles. One small survey isn't enough to meet that goal. The agency account reports a five-year mean of 3,745; the mean of our rounded annual values is 3,754.4. That difference remains unresolved in the detailed evidence. Preserve the agency's reported mean and the calculation from rounded annual values as separate records rather than change a year to force agreement. The goal applies to the stated averaging period, not a favorable single survey.
Measurements show a patchy picture
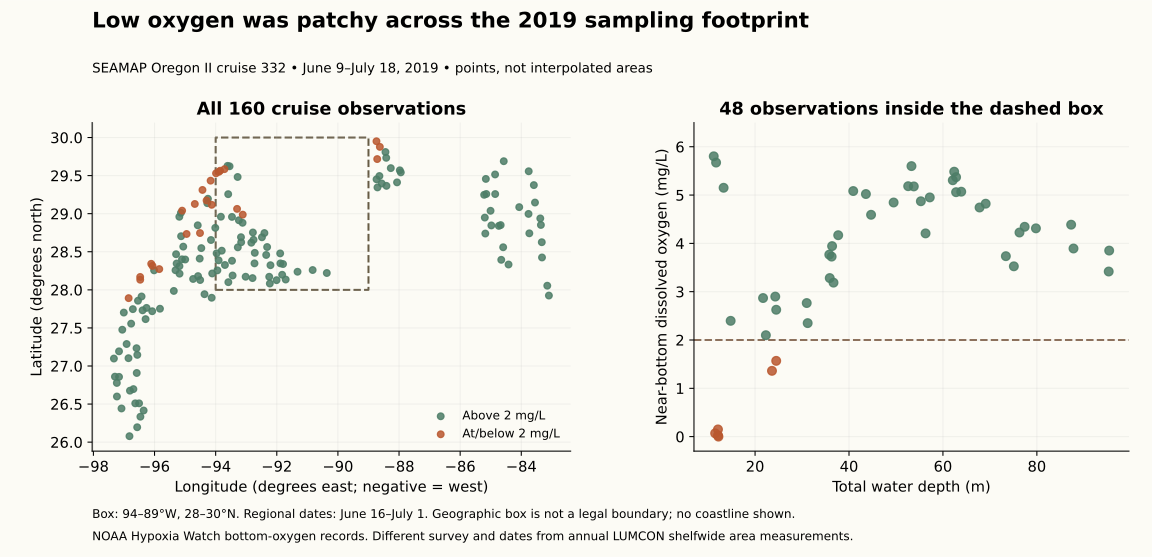
A separate 2019 research cruise supplied 160 usable bottom-oxygen observations. Within the area chosen for this comparison, 6 of 48 observations met the low-oxygen threshold.
That is a count of sampled points, not a finding that 12.5% of the seafloor was low in oxygen. Measurements came from different places and days. Shallower groups had more low readings in this sample, but location and timing changed too; it doesn't establish a rule to fish deeper.
The saved 2026 station service supplied 189 locations with no usable oxygen readings. Blank means unknown, not zero oxygen. The 2019 bottom observations aren't complete surface-to-bottom profiles, and the two depth columns have a documented discrepancy. The original methods preserve those limitations. The retained oxygen rows describe sampled stations, not an interpolated oxygen map or complete water-column profile. Keep position, sampling date, oxygen and the available depth labels together, leaving the depth discrepancy unresolved.
Null readings in the newer service cannot be substituted with the historical values or counted as measured zero oxygen. They describe what that saved response supplied, not proof that no observations exist in any other archive.
What the fish study adds
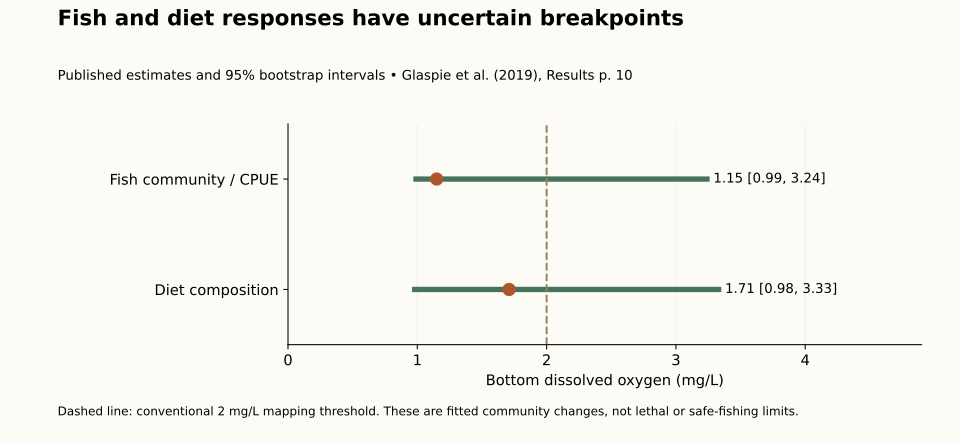
Researchers in a separate 2006–2008 study used nets to collect fish and compare catches and stomach contents with oxygen conditions. Catch per unit effort means catches divided by the fishing used to obtain them—in this study, fish per minute at the intended net depth.
Several species had lower catch rates in low-oxygen areas, and some feeding groups had different diets. The net could collect fish while being raised or lowered, so a catch over low-oxygen bottom doesn't prove the fish lived in that bottom layer.
The study estimated breakpoints, levels where catches or diets appeared to change. The ranges of uncertainty around them were wide and overlapped. They aren't precise boundaries telling you where a fish will leave or survive. This site's 2019 oxygen records were not joined to those earlier fish catches. A fitted breakpoint summarizes a change in the study records; it is not the same quantity as the conventional mapping threshold or a universal animal-survival boundary. Gear, sampled layer and collection timing remain part of interpreting the catch rate and diet.
Use the habitat idea when planning
A reef is an underwater feature fish may use. Its shape is only part of the habitat: oxygen, temperature and available food matter too. Fish may use water above the bottom or gather in a smaller usable area.
An old oxygen map or a mark on a fish-finding screen doesn't measure oxygen at your fishing spot today. These records supply no fishing-depth prescription, best reef, release-device setting or catch forecast. The red-snapper guide and offshore methods lesson explain the activity; the reef study explains why concentrated fish and a growing population are different findings.
The original analysis uses retained agency records and an attributed fish paper. Missing profiles and raw fish histories remain missing, and independent scientific review remains pending. When reading the detailed results and source-access notes below, keep forecast area, survey footprint, sampled-point count and fish-study outcome separate. More fish caught in a small usable area is not by itself evidence of more healthy habitat or a larger population. These comparisons help interpret habitat information without choosing a fishing depth or release setting.