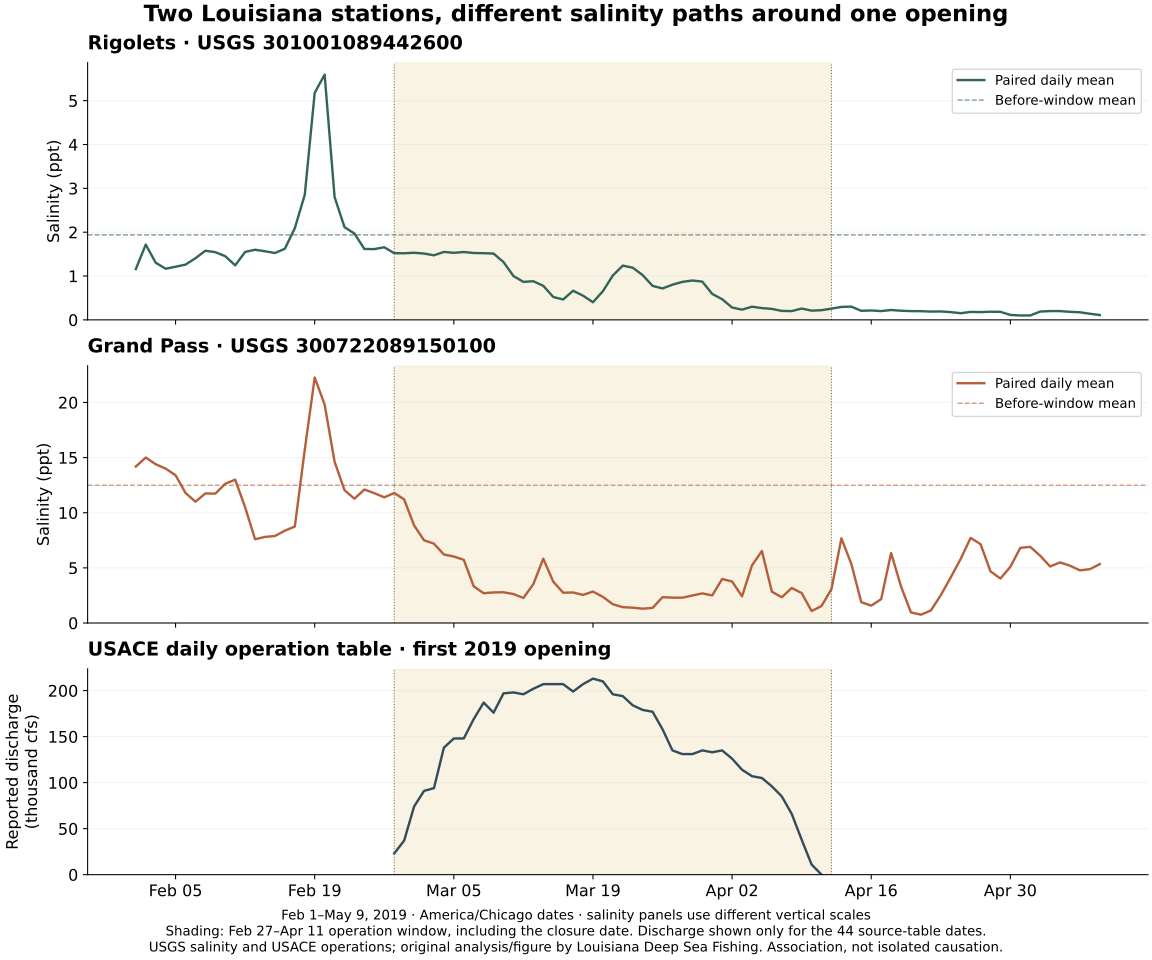
Salinity means how salty water is. A freshwater pulse is an input of fresh water into a system, which can change that saltiness. A spillway is a route used to divert water from a river. Opening the Bonnet Carré Spillway sends Mississippi River water toward Lake Pontchartrain. This study looks at saltiness around its first opening of 2019.
The two monitored sites changed differently. Both had lower average saltiness during the opening period, but after closure the Rigolets became fresher still while Grand Pass became saltier than during the operation. Neither matched its earlier average. Closing the gates didn't restore the earlier saltiness at either sensor.
Read this as a comparison of named sites and time windows. ‘After closure’ identifies the calendar period, not a recovered condition or a measured arrival/departure time for spillway water.
Meet the places and the unit
The Rigolets station is at Highway 90 near Slidell. Grand Pass is farther east in the western Mississippi Sound. These are two observation points in a connected coastal system, not a complete map of its water.
The records use parts per thousand, or ppt, for salinity. Higher numbers mean saltier water. The U.S. Geological Survey, or USGS, supplied the calculated salinity values in the monitoring records; this site did not collect laboratory samples.
A sensor measures at its own location and mounting depth. Surface and deeper water can differ, so even a good station record doesn't describe every nearby pond or the full depth below it.
Compare before, during and after
The first operation ran from February 27 to April 11. Another opening began May 10, so the study ends on May 9. It uses:
- February 1–26 as a recent before comparison.
- February 27–April 11 as the operation window.
- April 12–May 9 as after closure, before reopening.
The first window is a comparison period, not proof of normal seasonal conditions. The operation window includes the closure date and doesn't mean the same amount flowed every day. The official operation record describes the gate schedule, not the amount reaching each sensor. Compare each station with its own earlier window before comparing the stations with one another; their different starting saltiness matters to the interpretation.
What the averages showed
At the Rigolets, the before, operation and after averages were 1.938, 0.857 and 0.188 ppt.
At Grand Pass, they were 12.491, 3.745 and 4.499 ppt.
Grand Pass started much saltier and had a larger drop. After closure, its average rose from the operation window while the Rigolets' average fell further. A single regional number or closing date would hide those differences. Keep both comparisons explicit: change from before to operation, then change from operation to after. An increase after closure is not the same as a return to the earlier average.
The lowest seven-day averages also occurred in different weeks. Those are summaries of the sensor records, not measured travel times for the same parcel of river water.
How the comparison was kept consistent
A pair here means a reading from each station at exactly the same date and time. The study matched approved USGS readings on a half-hour schedule. Of 4,702 expected slots per station, 4,692 had qualifying readings at both sites. Missing readings stayed missing; a reading from a nearby time was not substituted. Matching timestamps gives the two site summaries a common observation schedule. It doesn't make the sites identical habitats or show that the same parcel of water passed both sensors.
A day was included only if it had at least 80% of its expected paired readings. When combining days, each included day's average counted equally, rather than giving more influence to days with more readings. The analysis also required 90% and 100% completeness to see whether excluding less-complete days changed the result. The main pattern remains under those stricter checks.
The retained daily summary keeps expected and paired slots, the inclusion flag and each site's daily mean together. Read completeness before the mean: a blank is unavailable or excluded information, not freshwater with zero salinity. Equal weighting of admitted days is a different summary from pooling every reading into one period average. The stricter screens check sensitivity to completeness, not whether the spillway alone caused the changes.
The records were matched using UTC, a shared time standard, then grouped into local Central Time dates using the America/Chicago time-zone rules. The daylight-saving change means one date has fewer expected half-hour slots. The downloads retain those choices, operation records, source queries and exclusions. The original review used USGS records because documentation for another intended monitoring source was inaccessible. That source gap remains recorded with the methods; missing evidence is not presented as acquired data.
What an angler can learn
Check a relevant salinity observation with its place, time, unit and known depth. Compare its recent history instead of assuming closure means recovery. Clear or muddy appearance isn't a salinity measurement.
The spillway was an input during this period, but the study did not separate its effect from rainfall, other inflows, wind and mixing. Neither station is known to be an unaffected comparison site, or control. There are no fish-tracking or catch records here, so the data cannot tell you where redfish moved or which lure worked. Many readings describe the sampled event in detail; they are not many independent spillway experiments.
Use the brackish-water introduction to learn the setting and marsh-drain lesson to observe a particular feature. For a future salinity check, keep the station, observation time, unit, known sensor depth and recent history with the reading, recording an unknown depth as unknown. Don't transfer this event's window average to another pond or current date. This case teaches why local water and its history matter; it doesn't supply a statewide fishing forecast.