Wind and air pressure can affect coastal water height. This study asks a narrower question: did one specified calculation using recorded weather improve a tide-table estimate at Grand Isle?
It did not perform better than the tide prediction alone on the reserved final quarter of 2025. A good fit to earlier records failed to carry over to later months. That does not mean wind has no physical effect; it means this particular correction was not dependable in that comparison.
Read the finding in two separate comparisons: the finished correction against the tide prediction, then the contribution of wind relative to the model that already included season and pressure. A small gain in the latter does not establish a gain in the former.
What was the calculation trying to estimate?
A tide prediction supplies an expected height. A station observation supplies a measured height. Their difference—observed minus predicted—is called the residual here. Heights need a shared zero, or reference level, before they can be compared. The detailed results use Mean Lower Low Water (MLLW), a reference based on long-term low-water measurements rather than the bottom beneath a boat.
A positive residual means measured water was higher than the prediction at that matched time. The model tries to estimate this difference, which is then added to the predicted height. That residual is different from the model's error: an overestimated correction can put the resulting height too high.
A model is a specified calculation connecting inputs with an estimate. The combined model used a part representing time of year, plus air pressure and wind. Air pressure is the weight of the atmosphere pressing on a surface.
Wind direction means the direction it comes from. The calculation split wind into eastward and northward parts instead of treating its compass direction as an ordinary number. That avoids making directions on either side of north look far apart. A lag means using an earlier wind reading; this study compared five delays rather than assuming an instant response.
Why later months mattered
The analysis used three separate periods:
- Training: Use January 1–June 27 to work out the values in the calculation.
- Validation: Use July 1–September 27 to choose among the fixed wind delays.
- Test: Keep October 1–December 31 separate to see how the finished calculation performs on later records.
The chosen delay was 12 hours. That was the best of the five candidates for this design and validation period, not a physical rule for every bay. Three-day gaps separated the fitting periods, and the calculation was not refitted on the final test.
These were estimates using recorded weather, including pressure at the hour being estimated. They were not forecasts issued before the weather happened. A lagged wind input does not turn this into an advance forecast; the other measurements still have to be available.
Keeping the final period separate matters because it tests the chosen calculation on later records. Changing the design after seeing that result would need a fresh independent comparison; it would not improve the original reserved test retroactively.
Read the result as an average miss
Mean absolute error, or MAE, is the average size of a miss without positive and negative misses canceling. Lower is better.
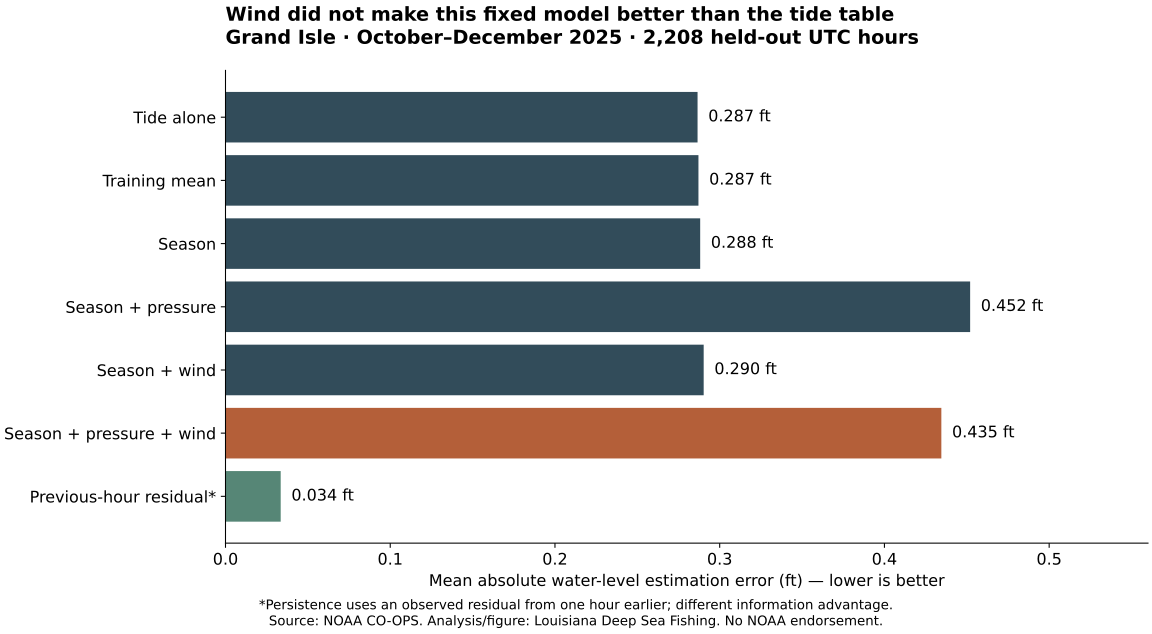
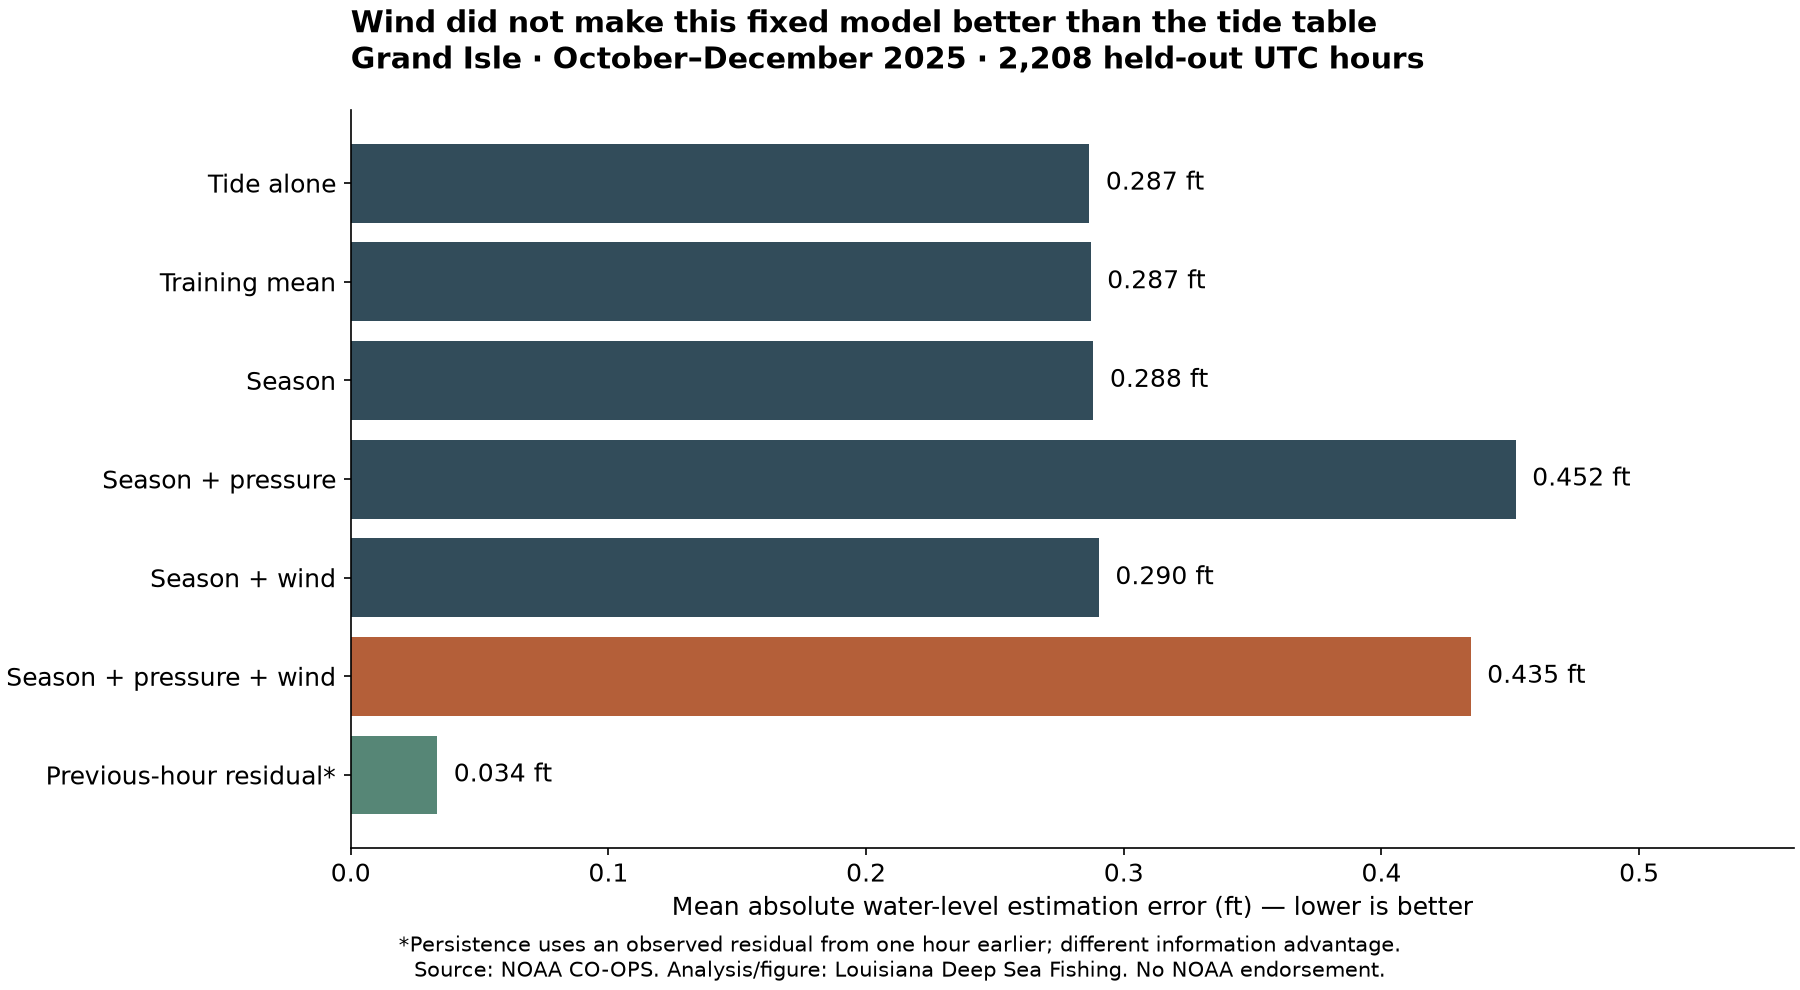
Across 2,208 test hours, the combined weather model missed by an average 0.435 feet, compared with 0.287 feet for the tide prediction alone. Its average signed error was about +0.425 feet: it estimated water too high overall.
Adding wind to the season-and-pressure model reduced that model's error by 0.017 feet, or 3.9%. That is an improvement over a different, poorly performing model—not a 3.9% improvement over the tide table.
The uncertainty check repeated the comparison using blocks of neighboring hours, rather than treating each hour as unrelated to the next. Weather and water conditions can persist over time. With 72-hour blocks, the central range for that wind increment crossed zero, approximately −0.002 to +0.038 feet. Shorter blocks gave a different range. The small increment deserves caution.
The resampling range is conditional on the fitted model and chosen delay. It does not include uncertainty from fitting or selecting the model, and it is not a guarantee for other stations, seasons or years. Crossing zero here means the resampling did not consistently support a positive wind increment for that comparison; it does not settle the physical role of wind.
How the records were compared
The National Oceanic and Atmospheric Administration, or NOAA, collected the source measurements. The detailed tables use UTC, a shared time standard for matching records. This site paired and analyzed its retained 2025 water, prediction, wind and pressure records at station 8761724. Of 8,760 expected hours, 8,693 met the shared requirements for every compared model and lag. Missing, flagged or inferred values were excluded; no missing observations were filled in.
A comparison carrying forward the previous hour's measured residual had a test MAE of 0.034 feet. It has information a tide table doesn't: a recent water observation. It illustrates the value of the measured water, rather than proving that yesterday's gap can be used indefinitely. Compare what information each benchmark receives as well as its error; the recent-observation comparison and tide prediction are not interchangeable forecasting services.
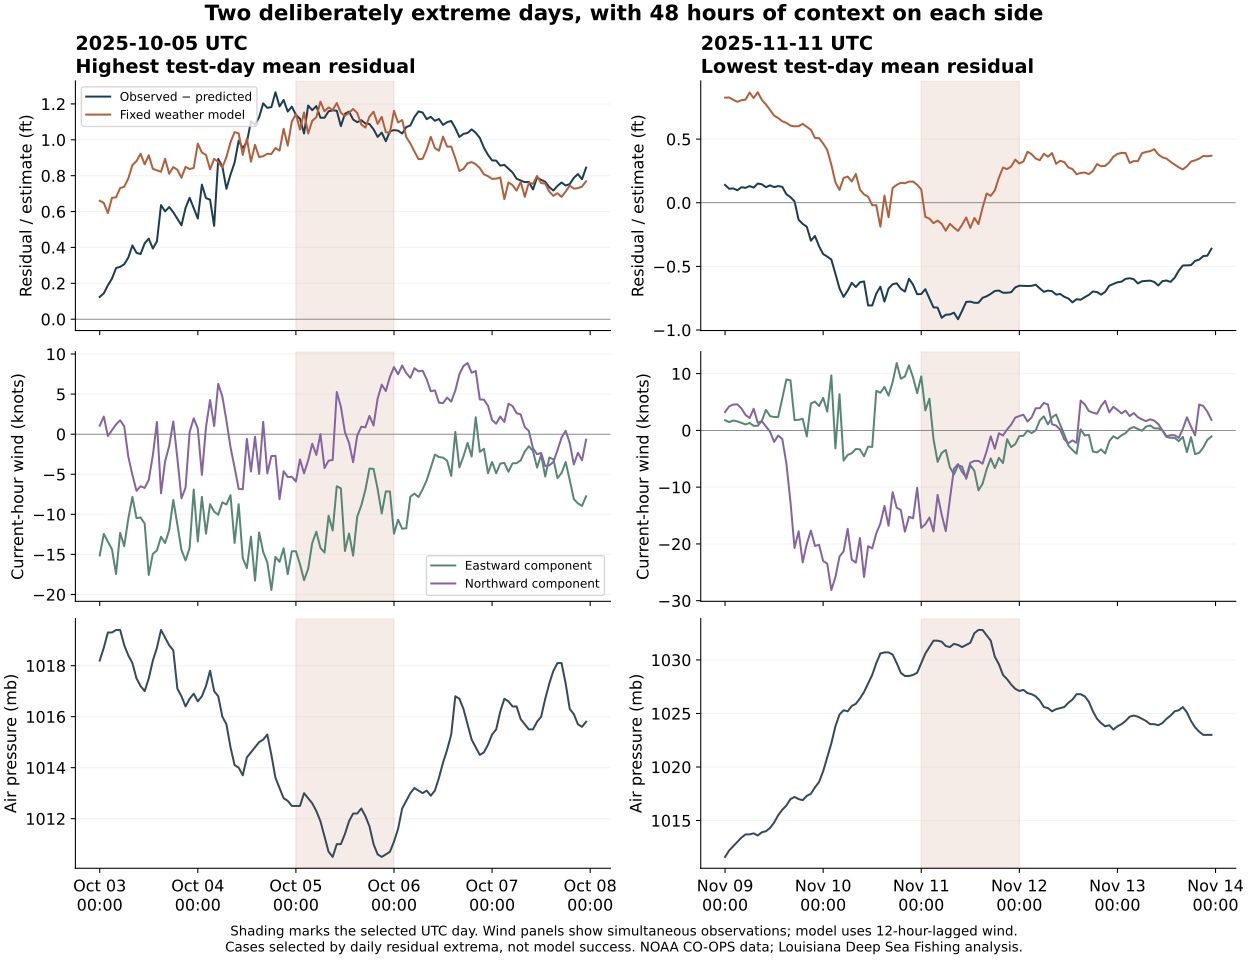
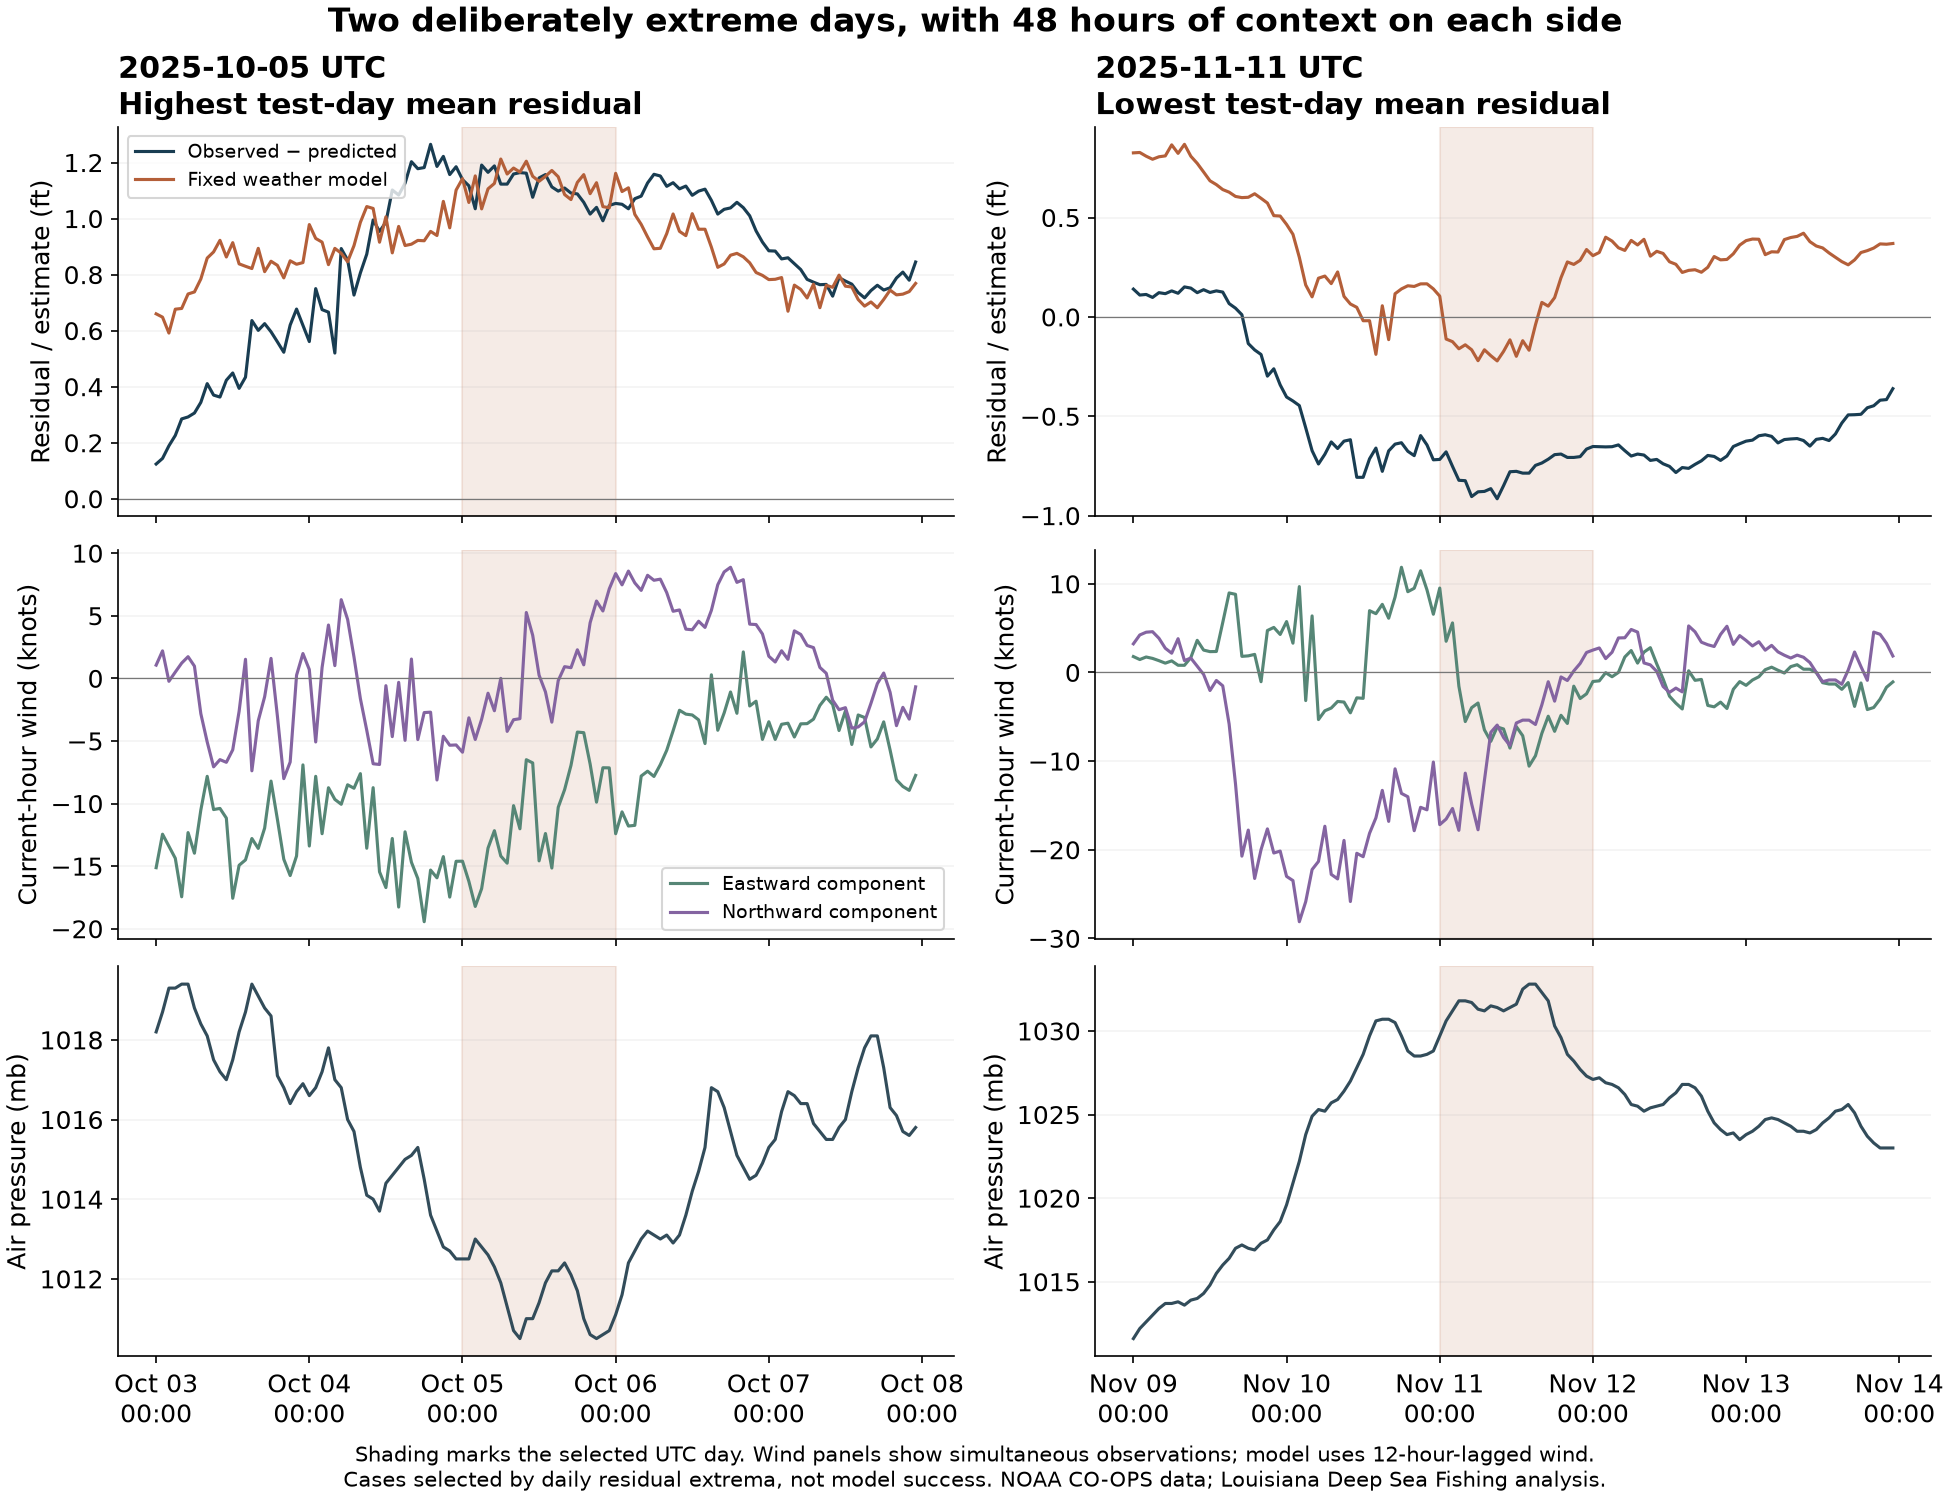
The detailed results also show two explicitly selected extreme days, October 5 and November 11. They illustrate high and low departures, not representative days or proof of a single weather cause. The downloads retain the protocol, exact screening, model definitions, sensor-metadata limits and resampling assumptions.
What to do with the finding
Read the tide prediction, relevant recent measured water and weather together. Match the station, time, units and reference level when comparing heights; check the weather information's area and time too. The tide introduction explains the height labels; the Grand Isle comparison shows why one annual adjustment is also misleading.
This study contains no catches, marsh-current measurements or bottom surveys. It doesn't give a wind allowance for a boat route or a best redfish condition. A new model or another station would need its own independent comparison. The useful lesson is to keep checking the water, rather than replace it with this wind calculation.
Keep three records distinct when using the page: the retained historical prediction, the measured water used in the comparison and the model's retrospective estimate. For an outing, separately check the relevant current sources and labels; this study does not update them. The retained methods note sets out the design, information limits and local review status. Numerical reproduction and independent scientific review are different checks; the latter remains pending.