A tide prediction is a calculated water height for a place and time. An observation is a measurement of what happened. This study compares the two at Grand Isle during 2025, using records from the National Oceanic and Atmospheric Administration, or NOAA.
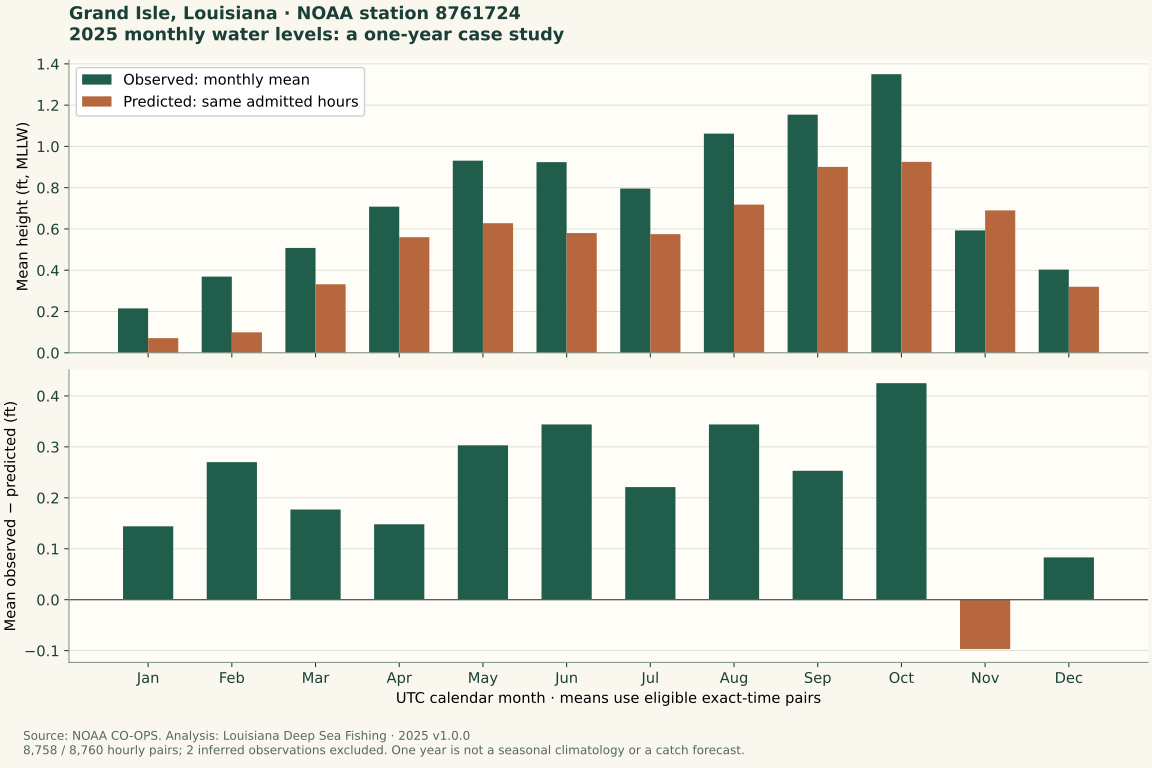
The gap changed through the year. One annual average would have hidden months when measured water was above the prediction and a month when it was below. That is a useful reason to read recent observations as well as a tide table.
Read this as a matched historical comparison: the same station, hour, units and reference level on both sides. It describes how the retained prediction and measurement differed, not what caused each gap or what adjustment to use on the next outing.
Understand the numbers first
A station is a particular monitoring location. This one is NOAA station 8761724. A water-height number uses a reference level, like the zero mark on a ruler. This study uses Mean Lower Low Water, shortened to MLLW, a reference based on long-term low-water measurements. It is not the bottom beneath the station.
We subtract predicted height from observed height. A positive result means the measurement was higher. A negative result means it was lower. This is a difference in water height. It doesn't tell you the depth under a boat or the speed of a current, meaning water moving in a direction.
An average, or mean, adds values and divides by how many there are. When averaging signed gaps, positive and negative values can cancel each other. For an absolute difference, ignore the minus sign on each gap before averaging, so its size still counts whichever side of the prediction it falls on.
The signed average describes how much measured height was above or below prediction on average after positive and negative gaps offset one another. The absolute average answers the size of the gap without cancellation.
What the year showed
The average observed-minus-predicted difference was +0.425 feet in October and −0.097 feet in November. Across the hours included in the year, the signed average was +0.218 feet, while the average absolute difference was 0.300 feet.
Those are historical summaries. They don't mean every October hour was high, or that adding 0.218 feet would correct the next tide prediction.
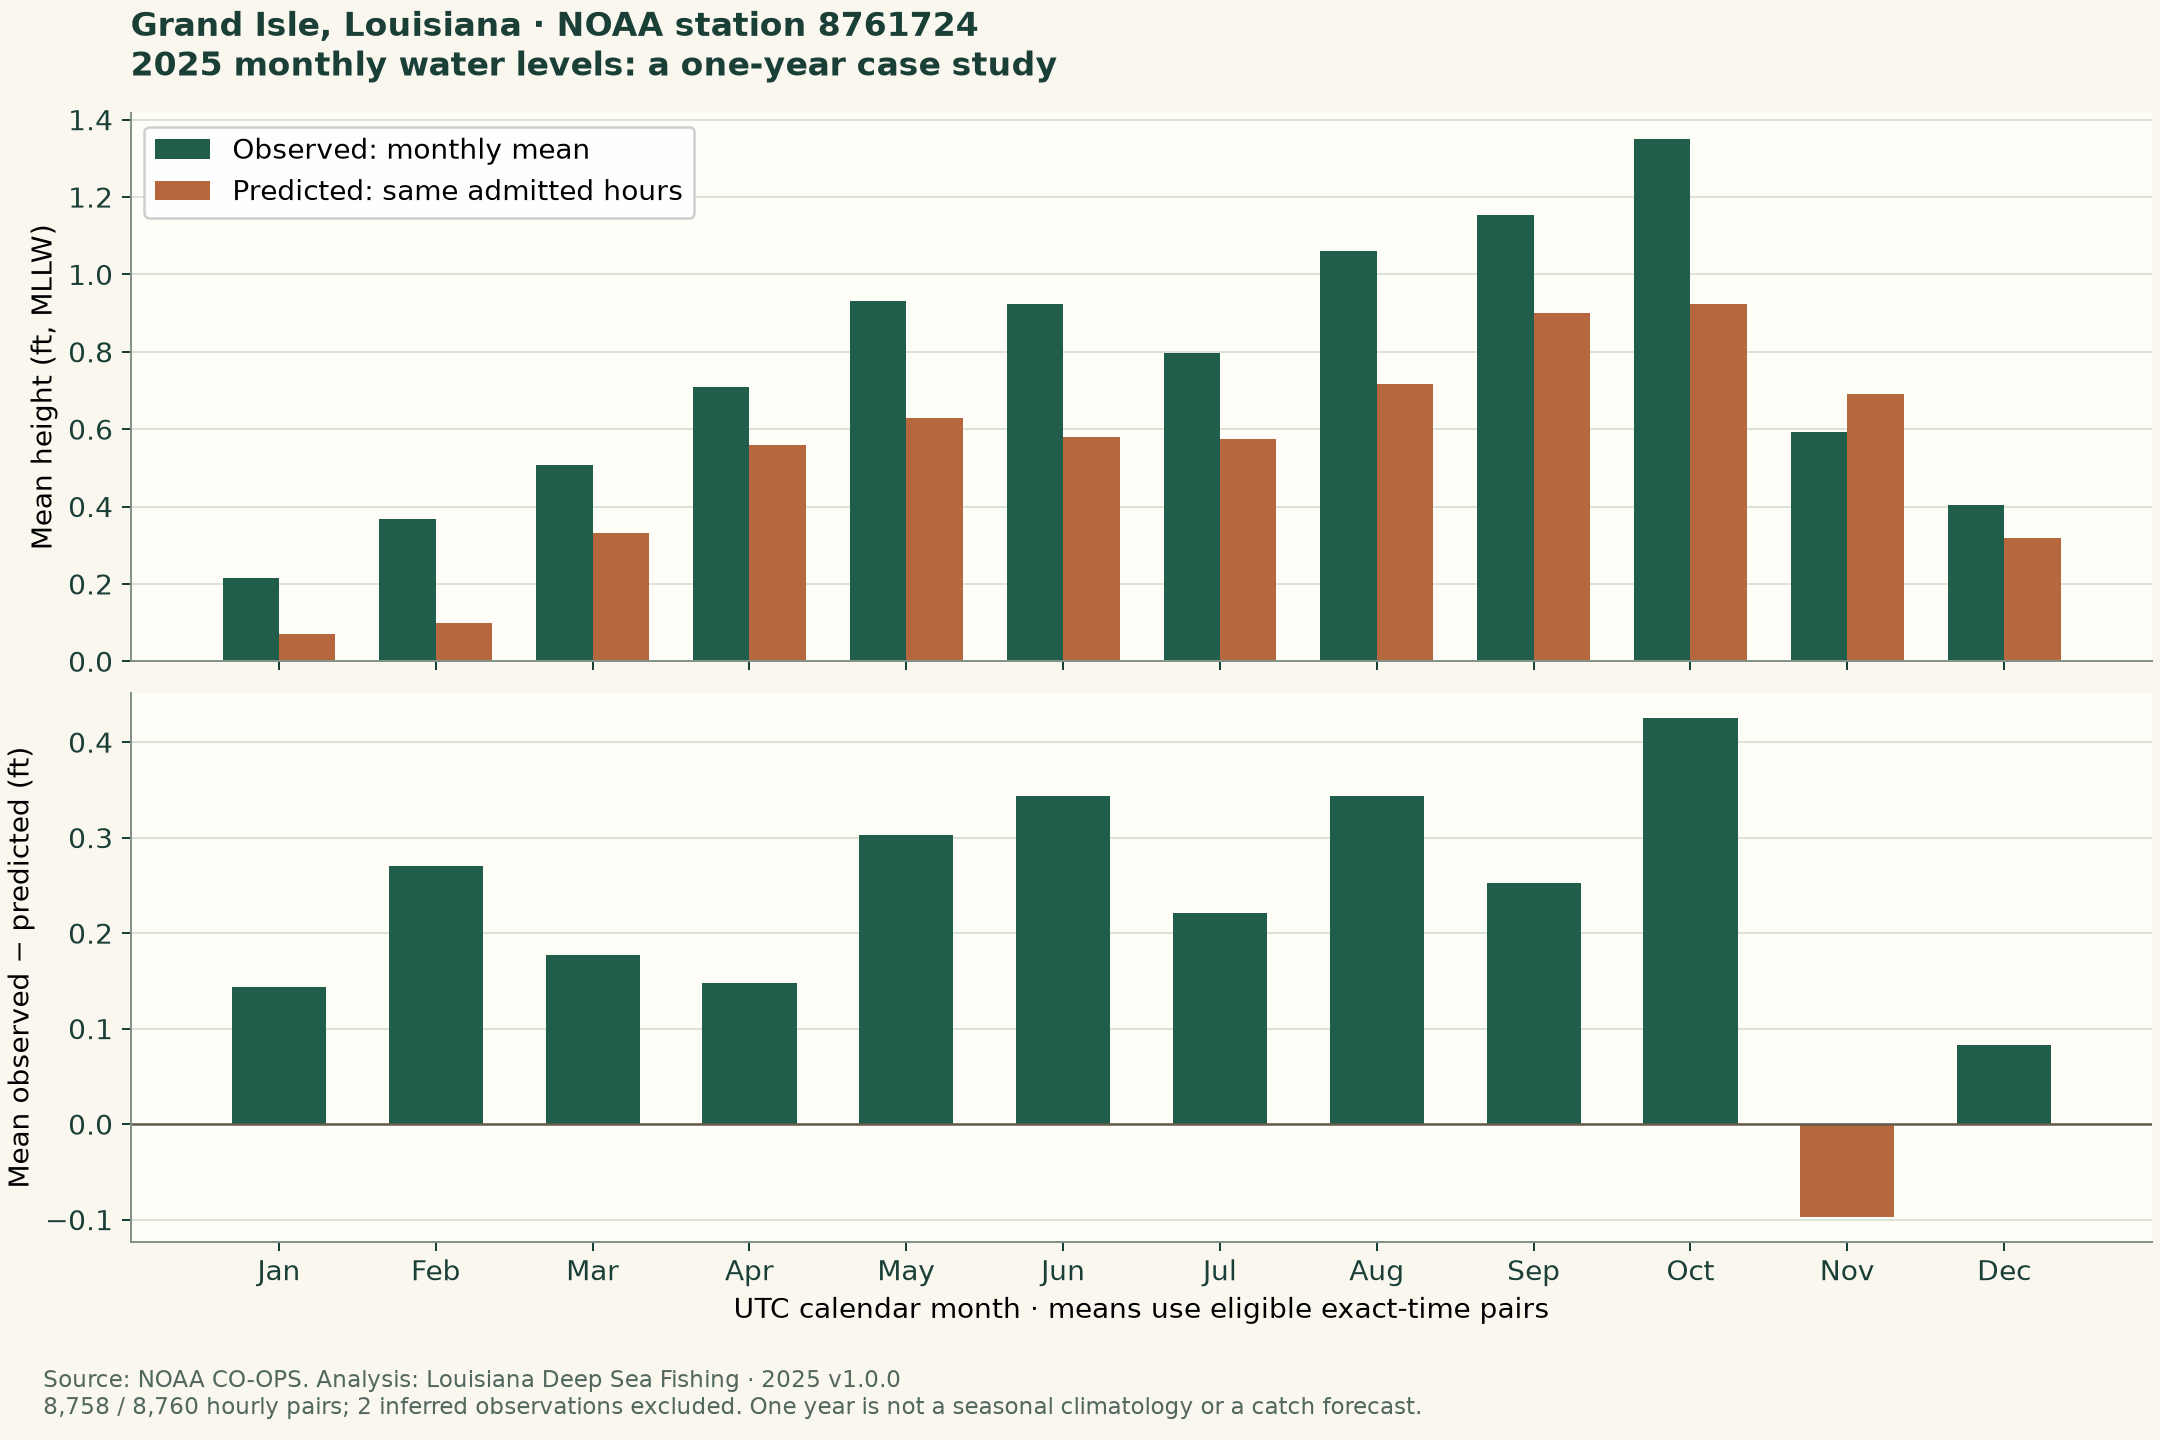
In the chart below, the upper panel compares monthly measured and predicted heights. The lower panel shows their difference. Read both: a higher measured level alone doesn't tell you that its gap from prediction was larger. Compare the same month across the panels, then use the sign of the lower-panel gap to distinguish above from below prediction.
The retained monthly summary keeps each month's included-hour count with measured height, predicted height and the signed and absolute gaps. Read the gap columns directly: the displayed means are independently rounded, so subtracting printed heights can differ slightly from the saved paired-gap summary.
How the comparison was made
The analysis used hourly NOAA measurements and predictions for January 1–December 31, 2025, matched at the same times, in feet and UTC. UTC is a shared time standard used to align records.
There were 8,760 expected hours. Two inferred observations—values marked as estimated rather than accepted measurements—were kept in the saved record grid but excluded from calculations. That left 8,758 eligible pairs, each containing a measurement and prediction for the same hour. Missing or excluded measurements were not filled in. A row retained in the saved hourly grid is therefore not automatically an eligible pair. Keep the expected grid, included pairs and exclusion reasons distinct when reading coverage.
Monthly averages use the same included hours for both sets of heights. Seasonal averages combine those hours directly. Here, winter combines January, February and December within calendar 2025; it isn't one continuous winter across two years. These are hour-weighted summaries of the admitted pairs, not an equal average of printed monthly averages. The grouping describes this retained year rather than a long-term seasonal normal.
NOAA collected the measurements. This site paired and summarized the retained records. The calculation method, analysis rules and source history record which readings were included, how terms were defined and where the records came from. The original trial covering September alone remains available separately.
Use the finding on a fishing day
When comparing a prediction and observation, match the station, time, units and reference level. The tide introduction explains those labels. Check relevant recent observations instead of treating this historical average as today's adjustment. A future prediction and an earlier ‘latest’ measurement are not the same timestamp: match pairs when assessing a gap, then retain each source's actual time for planning. If a station, unit or reference label differs, resolve that before subtracting.
At the actual fishing feature, observe moving water separately. A station's height doesn't supply the current through every connected drain. The marsh-drain lesson helps you start with that local observation.
What this study leaves open
This is one station and one year. It doesn't establish a long-term seasonal pattern, a future forecast or the causes of every gap. The records were retrieved in October 2026; the study didn't reconstruct the exact information available to an angler on each day in 2025.
There are no fish catches, effort records, bottom surveys or marsh-current measurements here. Use the results to understand the water information, not to select a best bite or boat route. The separate wind study asks whether adding recorded weather improved an estimate on later months. Its model comparison is a different question from this descriptive annual summary.
Keep measurement collection, this site's calculation checks and independent scientific review distinct. The saved files make the method inspectable; they do not establish independent review, which remains incomplete.