
Yellowfin tuna are open-water fish pursued on some Louisiana Gulf trips. A seasonal pattern may help you compare dates, but it doesn't tell you whether one boat will catch a tuna on one day.
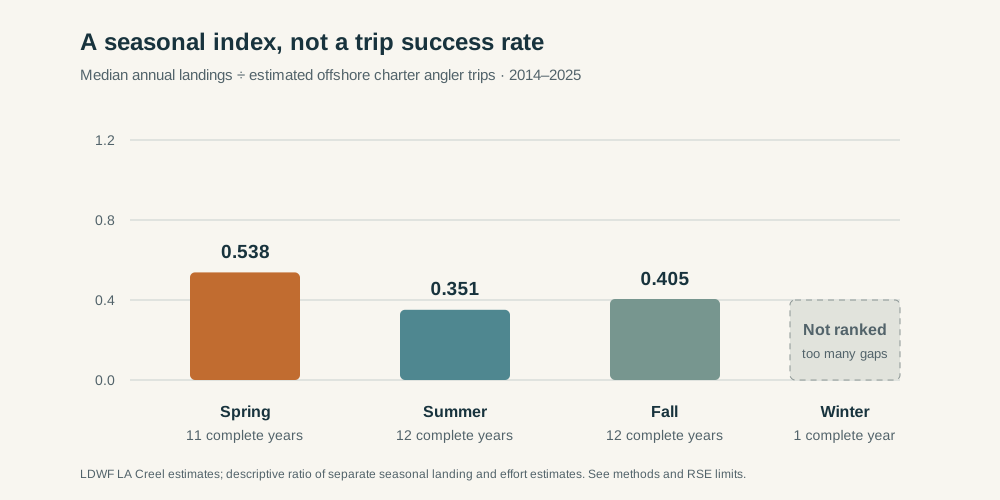
In these 2014–2025 records, spring deserves consideration alongside summer. The winter data are too incomplete for a fair ranking. Read that as a comparison of separately estimated landings and broad offshore-charter effort, not a ranking of individual tuna bookings. The available months, effort definition and uncertainty are part of the finding.
Start with what was counted
The Louisiana Department of Wildlife and Fisheries publishes survey-based estimates through LA Creel, its recreational fishing survey. A survey estimate uses sampled information to describe a wider fishery; it isn't a complete tally of every trip.
Landings means fish brought ashore. An angler trip is one person's trip, not one boat departure. Six people on a boat can contribute six angler trips.
This analysis divides estimated yellowfin landings by estimated offshore charter angler trips. That gives a comparison number, or index, in fish per estimated angler trip. The effort includes offshore charter fishing whether or not tuna was the target.
The two estimates are separate tables, not joined boat-by-boat catch records. There is no flag identifying which of those effort trips targeted yellowfin or caught one, so the denominator cannot be read as dedicated tuna-trip effort. A value of 0.538 doesn't mean a 53.8% chance of catching tuna, and it isn't fish per boat trip.
Compare the same seasonal groups
Spring is March–May; summer is June–August; fall is September–November. Each year's seasonal total is divided by its matching estimated angler trips, then the annual results are compared.
The median is the middle of the yearly values after putting them in order; if there are two middle values, it uses their average. That gives a different summary from adding all years' fish and dividing by all years' trips. In the annual comparison, first check how many catch-month estimates are displayed for the season-year. An incomplete row can retain useful recorded information without joining the complete-group median.
- Spring: 11 of 12 complete year groups; median index 0.538, ranging from 0.245 to 1.100.
- Summer: 12 of 12 complete groups; median 0.351, ranging from 0.080 to 0.635.
- Fall: 12 of 12 complete groups; median 0.405, ranging from 0.128 to 0.929.
- Winter: only 1 of 12 complete groups, so no comparable median is presented.
The index is fish per estimated offshore charter angler trip. Winter groups January, February and December within the same calendar year; it isn't one continuous winter across two years.
 Open the full-size illustration →
Among the 11 years with complete spring/summer pairs, spring was higher in nine. Fall was higher than summer in eight of twelve pairs. The range still varies substantially between years. These descriptive counts aren't a statistical test establishing one best season. The paired-year statement uses years where both compared seasons are complete; it isn't a comparison of every spring boat with every summer boat. Keep that paired subset distinct from the full set of seasonal rows.
Why more total fish can give a different answer
The displayed spring months total 33,824 estimated landings alongside 55,284 estimated angler trips. Summer totals 46,158 landings alongside 126,040 trips. Summer had more fish and much more fishing effort.
The pooled ratios, calculated by dividing the combined fish total by the combined trip total, are 0.612 for spring and 0.366 for summer. They aren't the median annual values listed above. Both comparisons still depend on uncertain survey estimates.
The pooled calculation uses displayed-month totals, including recorded months in incomplete groups, and gives more weight to records with more estimated effort. The median describes the middle of the complete annual season indices. Read each under its own label rather than select whichever figure makes the season sound strongest.
Why winter stays unresolved
Only one same-calendar-year winter group has displayed catch estimates in all three months. A missing row is unknown, not a zero catch. An unranked winter is an evidence limitation, not a finding that winter produced no fish or performed worse than every other season.
The agency supplies relative standard error, or RSE, to describe how uncertain an estimate is compared with its size. Higher values call for more caution. All 22 displayed winter catch estimates exceed 30 RSE, and 19 exceed 50.
Across the full record, 104 of 129 catch estimates and 104 of 144 effort estimates exceed 30. This analysis does not combine them into a new uncertainty interval: the query does not publish the information needed to account for how the catch and effort estimates vary together.
Use the finding to compare the actual outing
Ask what fish the trip is designed around, what guests will do and how travel affects fishing time. A general offshore outing and a dedicated tuna trip needn't offer the same activity. The yellowfin guide introduces the fish and trip; the offshore methods lesson explains the fishing jobs.
These records contain no individual trip-success flag, fish-size comparison or time spent targeting tuna. They don't separate weather, cancellations, boat decisions or migration as causes. The biological studies in the sources give context, not an explanation fitted to this seasonal index. Ask the provider about the actual target, method, guest tasks, ride, total time and alternatives for your dates. Keep that booking reply separate from the historical index; neither a seasonal median nor a higher landings total establishes the outcome of that trip.
Detailed records and downloads
The saved query used 2014–2025, Offshore basin, Charter Boat activity and Yellowfin Tuna landings, paired with effort for the same years, basin and activity. The original query date and source limitations stay in the methods.
The season summary and annual comparison are CSV files: rows you can open in a spreadsheet. The results record is JSON, a labeled format for software. These are the saved summaries calculated from the query results. A raw agency row export was not saved here. Start a download comparison with the year, season, catch-month count, landings, matching effort and index label. Blanks remain unknown; printed rounding is not evidence that uncertain estimates became exact.
The missing raw export limits a source-row audit from this packet. The derived files make the retained calculation inspectable, but they are not a substitute for an acquired agency export or a fresh source check. Independent fisheries/statistical review remains pending.
This is a descriptive comparison of agency estimates, not a new population assessment or controlled fishing experiment. It provides a reason to compare spring options while leaving winter and your individual trip's result open. Use the record to ask better date and participation questions, not to create a boat-level success percentage, a new uncertainty interval or a causal seasonal rule.